
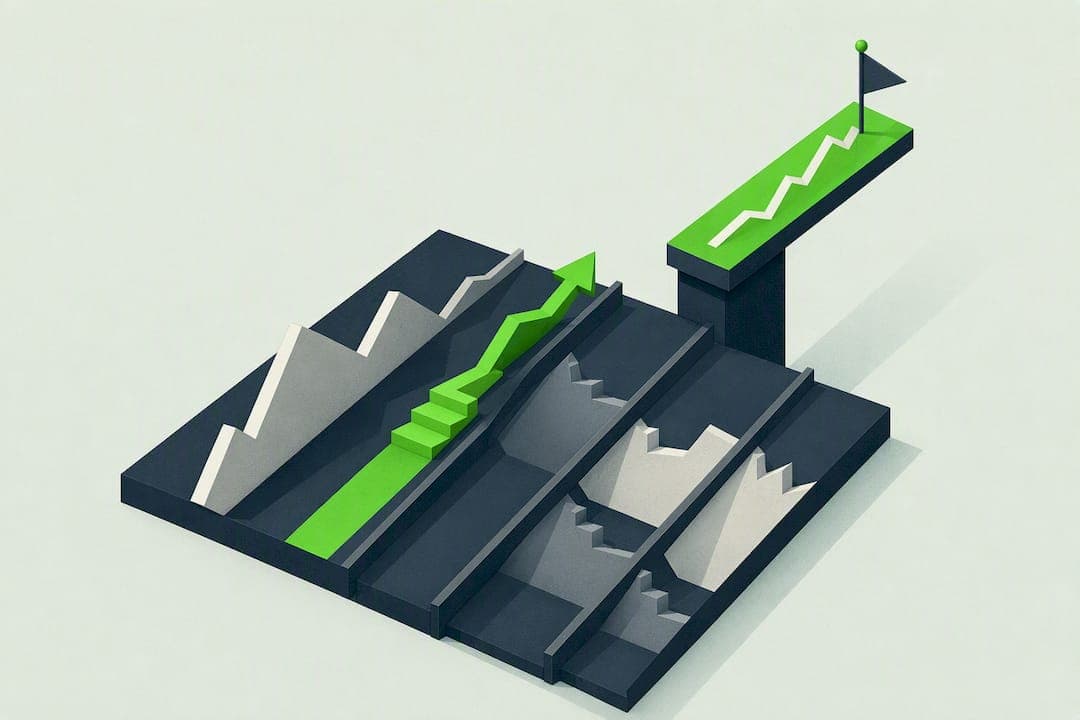
Market breadth indicators measure how many stocks are actually participating in a market move, not just how far the index traveled. The single most useful habit you can build is treating breadth as confirmation: a rally backed by broad participation tends to hold, while one carried by a handful of mega-cap names tends to crack.
TL;DR:
- Breadth signals are most reliable when multiple horizons and metrics, such as the advance/decline line and percent above moving averages, all align in the same direction.
- Extreme readings below 20% or above 80% on these horizons typically indicate significant oversold or overbought conditions, often preceding major market reversals.
- Divergences between breadth and price, especially when the index reaches new highs while breadth fails to confirm, suggest narrowing leadership and elevated reversal risk.
- Rare signals like the Zweig Breadth Thrust require strict conditions, with a cluster of occurrences indicating a potential regime change rather than casual market fluctuations.
- Accurate interpretation depends on matching the breadth universe to the trading context and verifying data source consistency to avoid misleading signals.
Table of Contents
- What Market Breadth Indicators Are and Why They Matter
- Primary Breadth Indicators and How Each Is Calculated
- How to Measure Breadth Correctly
- How to Interpret Breadth: Participation, Divergence, and Confirmation
- Common Breadth Signals, Thresholds, and Historical Examples
- Tools, Dashboards, and Where to Check Live Breadth Data
- Limitations and Common Mistakes When Using Breadth Indicators
- A Trader's Daily Checklist for Reading Market Breadth
- Where to Verify Breadth Formulas and Live Data
- Sources
- FAQ
What Market Breadth Indicators Are and Why They Matter
A cap-weighted index like the S&P 500 can rise while most of its constituents fall. That happens whenever a small number of heavily weighted stocks do the heavy lifting. Market breadth indicators exist to catch exactly that gap between what the headline number shows and what is happening underneath it.
Breadth, in its simplest form, tracks the share or count of stocks moving in the same direction as the index. Positive breadth means more stocks are advancing than declining, which tends to confirm bullish momentum in the broader tape. Negative breadth flags the opposite: more decliners than advancers, even if the index itself hasn't cracked yet, according to the standard breadth-of-market framework. That distinction, participation versus magnitude, is the whole point of breadth analysis. Magnitude tells you how far price moved. Participation tells you how many stocks agreed with that move.
Time horizon changes what a breadth reading actually tells you. A 10-day moving-average breadth line reacts to short-term twitches, useful for day traders and swing entries. A 50-day line captures the intermediate swing that position traders care about. Stretch out to 100 days and you're looking at intermediate trend health. The 200-day line is the regime filter, the one that tells you whether the broader market environment favors risk-taking or defense. Each horizon answers a different question, and reading them together, rather than picking one, is where breadth analysis earns its keep.
A few structural facts shape how you should think about breadth before you look at a single chart:
- Breadth is a participation metric, not a price metric; it can diverge from the index for weeks before price catches up.
- Shorter moving-average horizons (10 day) are noisy and better for timing entries than for judging the overall market health.
- Longer horizons (200 day) move slowly and are better suited to deciding whether to be aggressive or defensive at all.
- The universe you measure breadth against, S&P 500 versus the full US common-stock universe, changes the signal's meaning, since a narrower universe skews toward large caps that already drive the index.
- Extremes matter more than the middle. A reading sitting in the 40 to 60% range on any horizon usually just reflects a market waiting for a catalyst.
Primary Breadth Indicators and How Each Is Calculated
There are five workhorse breadth indicators every trader should know how to compute or at least recognize on a chart. Each one uses a different input, some count issues, some count volume, and each answers a slightly different question about market internals.
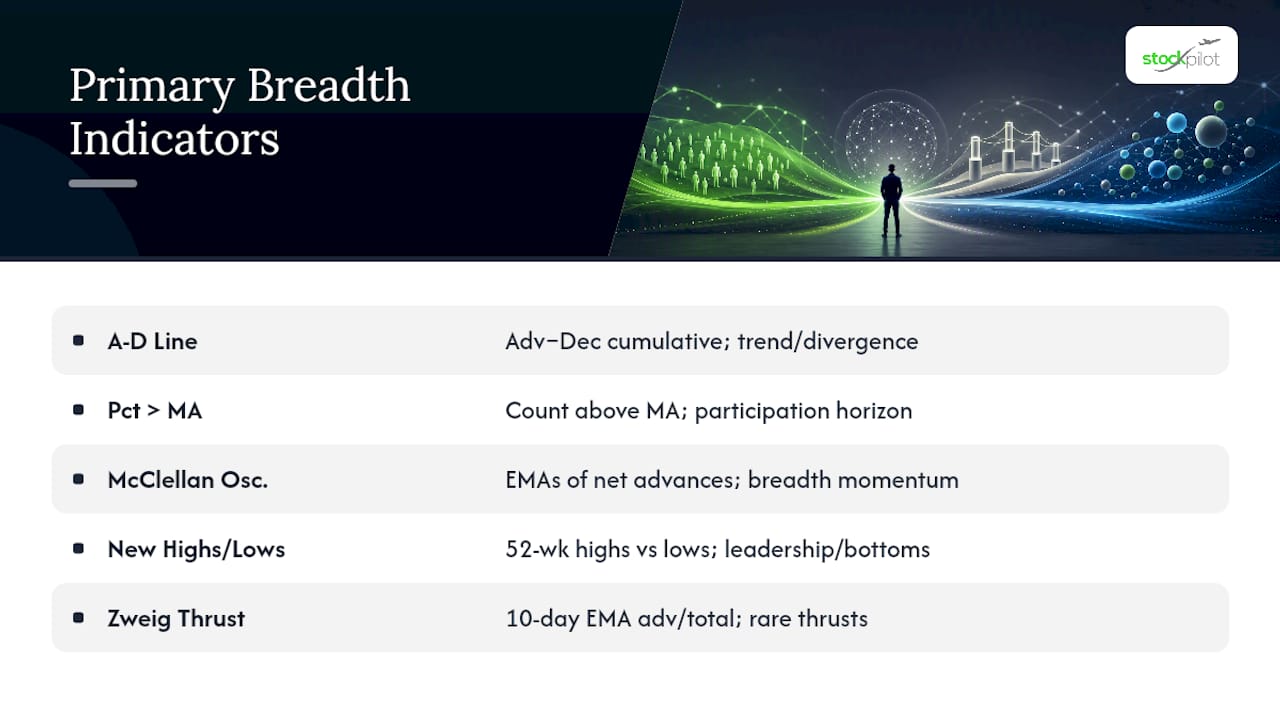
The Advance/Decline Line. This is the oldest and simplest breadth tool. Each day, you subtract the number of declining stocks from the number of advancing stocks, then add that net figure to a running cumulative total. The formula is just: A-D Line (today) = A-D Line (yesterday) + (Advancers − Decliners). The line itself doesn't matter in absolute terms; what matters is its slope and, critically, whether it's making new highs alongside the index or lagging behind it. A rising A-D line that tracks the index confirms the trend. When the index prints a new high but the A-D line does not, that divergence is one of the most closely watched warning signals in breadth analysis.
Percent of Stocks Above a Moving Average. This indicator tests every stock in your universe against its own 10, 50, 100, or 200-day moving average, then divides the count of stocks above that average by the total universe size. If 2,600 of 4,750 eligible stocks trade above their 50-day average, that line reads 54.7%. This is arguably the most versatile breadth tool because you can layer horizons: watching the 10-day, 50-day, 100-day, and 200-day percentages together across roughly 4,750 US common stocks shows you short-term twitch, swing-trader conditions, intermediate trend, and long-term regime all at once.
McClellan Oscillator and Summation Index. The McClellan Oscillator smooths the daily advance/decline differential using two exponential moving averages, typically a 19-day and 39-day EMA of net advances, then subtracts one from the other. It's a momentum-of-breadth measure, designed to catch acceleration or deceleration in participation before price fully reflects it. The Summation Index is simply the running cumulative total of the daily McClellan Oscillator readings, giving you a slower, trend-following breadth momentum line.
New Highs, New Lows, and Up-Volume Days. Counting stocks hitting fresh 52-week highs against those hitting fresh 52-week lows gives you a leadership read distinct from simple advance/decline counts. A related volume-based signal, the 90% up-volume day, occurs when up-volume accounts for at least 90% of total volume across the exchange on a given session. These sessions are rare and tend to cluster near durable bottoms.
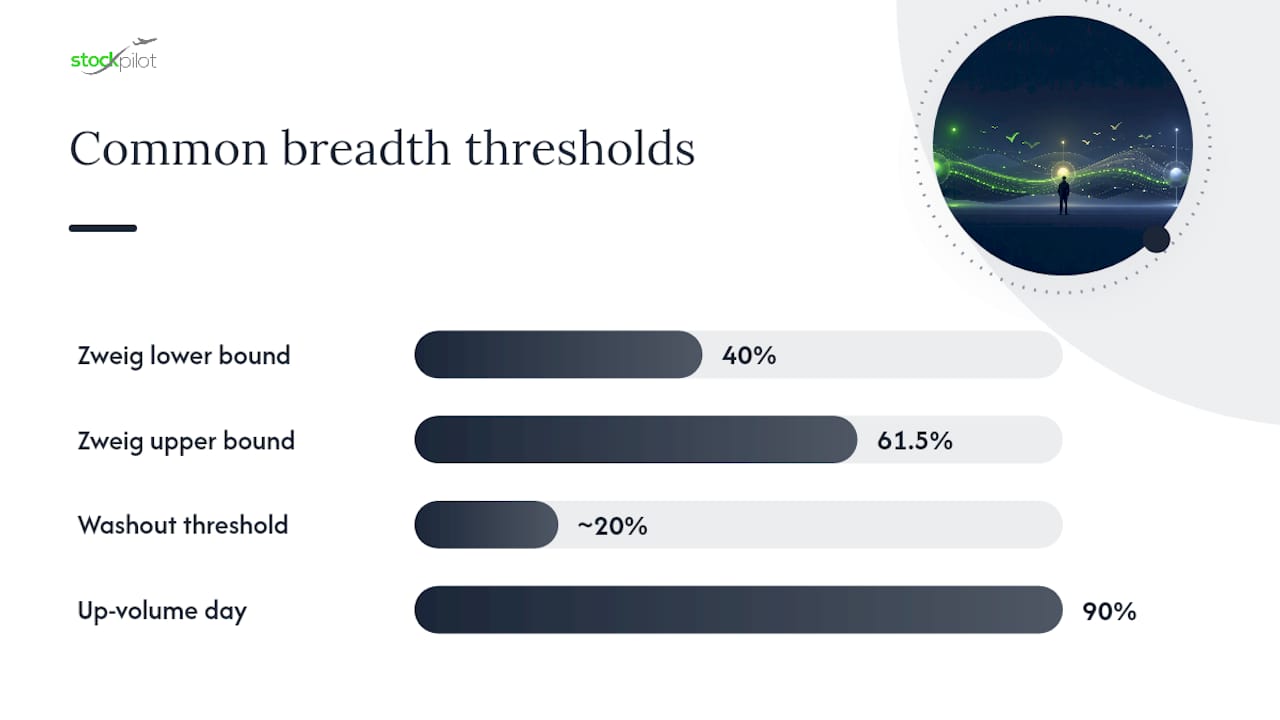
Zweig Breadth Thrust and Its Variants. This is the rarest and most closely watched breadth signal in the toolkit. The classic Zweig rule tracks a 10-day exponential moving average of advancing issues divided by total issues (advancing plus declining). A thrust fires when that ratio moves from below 0.40 to above 0.615 within a 10 trading day window, a rapid expansion in participation that historically marks the start of new bull phases. The rule is deliberately strict, and different implementations vary the window and universe, which is why event counts matter more than any single hit-rate claim.
Statistic worth sitting with: across a universe of roughly 4,750 eligible US stocks, moving-average breadth readings above about 80% or below about 20% are where the signal genuinely concentrates. Everything between those bands is closer to noise than to a tradable edge.
How to Measure Breadth Correctly
Breadth is only as reliable as the universe and denominators behind it. Get those wrong and you'll get confidently wrong signals.
Start by picking a universe that matches the job. If you're trading S&P 500 futures or an S&P index fund, breadth calculated against the S&P 500 constituents will track your actual exposure. If you're trying to gauge the health of the broader economy or small-cap risk appetite, you need the full US common-stock universe, sometimes 4,000 to 5,000 names depending on the data provider, because narrower universes skew toward the same large caps that already dominate cap-weighted indexes.
New listings create a quiet but real distortion. A stock that IPO'd three weeks ago doesn't have 200 days of price history, so it can't legitimately be tested against its 200-day moving average. The correct approach is to exclude it from that specific MA-breadth calculation until it has accumulated enough history, and to report the effective denominator for each horizon rather than assuming every line uses the same stock count. A 200-day breadth line and a 10-day breadth line drawn from the same "universe" often have different actual denominators once you account for listing age.
The arithmetic itself is simple. Say on a given day the NYSE reports 1,850 advancing issues and 1,240 declining issues. Advance/decline breadth reads 1,850 / (1,850 + 1,240) = 59.9%, comfortably bullish but not extreme. Now say you're testing percent-above-50-day-MA across 4,750 stocks and 2,565 close above their average: that's 54%, a middling reading that tells you the market is neither overbought nor washed out.
A few practical setup notes worth locking in before you build or subscribe to a breadth feed:
- Confirm whether the data source uses NYSE-only issues, S&P 1500 constituents, or the full US common-stock universe, since headline breadth numbers from different providers are rarely directly comparable.
- Check refresh cadence. Intraday feeds catch fast reversals; end-of-day feeds are fine for swing and position trading but will lag a same-day thrust.
- Ask whether preferred shares, closed-end funds, and ETFs are excluded from the advance/decline count, since including them dilutes the signal with instruments that don't represent operating companies.
- Verify historical depth if you plan to backtest a breadth-thrust rule, since rare-event signals need years of data to produce even a handful of occurrences.
How to Interpret Breadth: Participation, Divergence, and Confirmation
Reading a breadth number in isolation tells you almost nothing. Reading it against price is where the discipline pays off.
When an index rallies and breadth rallies with it, roughly proportional advancing issues and rising percent-above-MA lines, that's confirmation. It means the move has broad support and is less likely to reverse violently on the first piece of bad news. This is the scenario you want to see in the early stages of a new uptrend, and it's why breadth thrust signals get so much attention. A thrust is essentially a confirmation signal on steroids: not just broad participation, but a rapid acceleration into broad participation.
The warning case is the one that matters more for risk management. When the index prints new highs but the advance/decline line fails to confirm, or the percentage of stocks above their 50-day average is quietly declining even as the S&P 500 grinds higher, you're looking at narrowing leadership. This pattern shows up before nearly every meaningful correction, because a market that depends on fewer and fewer stocks to hold up the index has less structural support if any one of those leaders stumbles.
Regime filtering is where the slower lines earn their place in your workflow. When that same line drops below 30 to 40%, it's a signal to reduce risk exposure regardless of what any single stock chart looks like, since combining multiple MA horizons into a layered read catches disagreements between short-term bounces and long-term deterioration that a single line would miss.
The strongest signals combine breadth with price structure and volume. A breakout on rising price, rising volume, and rising breadth is a fundamentally different trade than a breakout on rising price with flat or falling breadth. The first has three confirming inputs. The second has one, and it's the one most prone to failing.
- Breadth confirming price: broad participation, lower risk of a sharp reversal, generally the environment to hold or add to positions.
- Breadth diverging from price: narrowing leadership, elevated reversal risk, a cue to trim exposure or tighten stops even if the index itself looks fine.
- Breadth sitting in the 40 to 60% middle range: low information content on its own, better paired with a trend or momentum tool for actual entries.
- Multiple horizons disagreeing (10-day up, 200-day down): a short-term bounce inside a longer-term downtrend, not a new bull phase.
Pro Tip: Don't chase a single breadth reading in isolation. Pull up the 10, 50, and 200-day percent-above-MA lines side by side. When all three agree, the signal is strong. When they disagree, the disagreement itself is the signal, telling you the market is at a transition point rather than in a stable trend.
Common Breadth Signals, Thresholds, and Historical Examples
Some breadth readings are common enough to check daily. Others are rare enough that a single occurrence becomes a case study traders reference for years.
The Zweig Breadth Thrust sits at the rare end. The rule requires the 10-day EMA of advancing issues divided by total issues to move from below 0.40 to above 0.615 within a 10 trading day window, a threshold deliberately built to be strict. That strictness is the point: a thrust is meant to identify genuine regime change, a market flipping from broad pessimism to broad participation fast enough that it can't be explained by ordinary mean reversion. Because qualifying events are so rare, the honest way to use this signal is as confirmation of a durable shift already underway, not as a frequent trade trigger you expect to fire every few months.
A cluster of them within a two or three week span is the pattern worth watching.
Moving-average breadth thresholds are the ones you'll actually use week to week. Readings below roughly 20% mark washout conditions, the kind of oversold extreme that has historically preceded sharp, broad relief rallies, since across a universe of about 4,750 stocks, that's where breadth extremes concentrate and carry real signal weight rather than noise, especially when measured across a large, diverse stock universe.
Worth noting as a statistic: breadth-thrust style events are rare by design, and reporting a raw "win rate" from a handful of historical occurrences is misleading. The more honest approach counts full historical events and reports them individually rather than compressing decades of market history into a single percentage that implies more statistical confidence than a small sample can support.
Here's the pattern distinction that trips up a lot of traders. But that same bounce, arriving alongside a rising 200-day line and a confirmed advance/decline line, looks structurally different: broad, durable, and worth participating in. The number alone doesn't tell you which scenario you're in. The context around it does.
- A single 90% up-volume day: notable, worth flagging, not yet actionable on its own.
- A cluster of 90% up-volume days within a few weeks: historically associated with durable bottoms.
- Zweig thrust firing while the 200-day breadth line is still falling: treat cautiously, it may be a bounce inside a larger downtrend.
- Zweig thrust firing alongside a rising 200-day breadth line: the stronger, more durable version of the signal.
Tools, Dashboards, and Where to Check Live Breadth Data
You don't need to hand-calculate advance/decline counts every morning. A handful of resource types cover the job, and picking the right one depends on how fast you need the data and how deep into history you plan to dig.
Live breadth dashboards are built specifically to display advance/decline counts, percent-above-MA lines, and McClellan readings updated throughout the trading day. Historical databases matter more for backtesting; you want a provider with enough depth to test a breadth-thrust rule across multiple market cycles, since a rare-event signal needs years of history to produce a meaningful sample. Charting platforms with built-in breadth studies let you overlay these indicators directly on price charts, which is genuinely the fastest way to spot a divergence.
When you're evaluating a specific dashboard or provider, a few features actually matter more than the interface polish:
- Universe coverage: does it track NYSE-only, S&P 1500, or the full US common-stock universe, and does that match what you're trading?
- Refresh cadence: some dashboards update intraday while others only post end-of-day figures, and the difference matters if you're trying to catch a same-session reversal.
- Download or API access: useful if you plan to build your own composite breadth score or backtest a rule systematically.
- Historical depth: a provider with only two years of history can't help you evaluate how a breadth-thrust rule performed across a full bear-to-bull cycle.
Research notes on an investor insights blog walk through how data-driven signals like these feed into broader portfolio decisions, useful context if you're trying to connect breadth readings to actual position changes rather than just watching a chart.
Limitations and Common Mistakes When Using Breadth Indicators
Breadth indicators fail traders in predictable ways, and almost all of them come down to context, not math.
The most common mistake is ignoring universe composition changes. If your data provider swaps which index constituents it tracks, or a wave of new listings enters the universe, your breadth line can shift for reasons that have nothing to do with actual market health. A second frequent error is conflating volume-based breadth (up-volume versus down-volume) with issue-count breadth (advancing stocks versus declining stocks). These measure different things: a handful of heavily traded mega-caps can dominate volume breadth while issue-count breadth tells a completely different story about the average stock. A third mistake is over-reading the 40 to 60% middle zone, where breadth genuinely carries low information content and is better left alone until it moves toward an extreme.
The fix for all three is the same discipline: cross-check breadth against price and volume before acting, and be explicit about which universe and denominator you're using. If you're testing a breadth-thrust rule historically, count actual events rather than relying on a summarized hit rate, since these are rare-event signals drawn from small samples across overlapping market regimes. Damodaran's caution about spurious indicators applies directly here: favor breadth measures with transparent, reproducible formulas over anything that can't be recalculated from raw advance/decline data.
- Don't treat a single day's breadth reading as a standalone signal; look at the trend of the line over several sessions.
- Don't mix volume-weighted and issue-count breadth measures without knowing which one you're looking at.
- Don't backtest a rare-event rule on a short data window; a handful of qualifying events isn't a statistically meaningful sample.
- Don't ignore denominator changes when a provider updates its tracked universe.
Pro Tip: *Before trusting any breadth signal, ask what universe it's built on and how many stocks are actually in the denominator that day.
A Trader's Daily Checklist for Reading Market Breadth
Every morning, three lines get a quick glance before anything else: the 10-day percent-above-MA for short-term tone, the advance/decline line for whether it's confirming or diverging from the index, and, once a week, the 200-day line to check the overall regime hasn't shifted underneath me.
Position sizing follows the regime reading, not the daily noise. That's the same logic behind some automated systems that shift capital toward Treasury ETFs when broad risk conditions deteriorate rather than waiting for a prediction to prove right.
The clearest recent example was a stretch where the index kept grinding to marginal new highs while the percentage of stocks above their 50-day average quietly fell for three straight weeks. That divergence alone was reason enough to tighten stops before the pullback showed up on the price chart itself.
— David Elliot
Where to Verify Breadth Formulas and Live Data
For readers who want to check the numbers themselves or build a custom breadth tracker, a few primary references cover the formulas and live series referenced throughout this piece:
- Market Breadth Today: % of Stocks Above the 10, 50, 100 & 200-Day Moving Averages, for live MA-breadth readings across the US stock universe.
- Breadth Thrust: Definition, Formula & Live Context, for the exact Zweig thrust formula and historical event framing.
- Breadth of Market, for the foundational definition and history of breadth analysis.
- Real Market Breadth Data reports and charts, for comparing intraday versus end-of-day dashboard options.
This article is general information, not a substitute for advice from a qualified financial advisor. Consult a qualified financial professional about your own circumstances before acting on anything here.
Sources
- Thetrading
- Thetrading
- Breadth of market - Wikipedia
- Aswath Damodaran — note on timing approaches and spurious indicators
FAQ
How do you measure market breadth?
You measure it by comparing advancing stocks to declining stocks on an exchange, using the formula advances divided by (advances plus declines), or by calculating the percentage of stocks trading above a chosen moving average, typically the 10, 50, 100, or 200 day.
What are breadth indicators?
Breadth indicators are tools that track how many stocks are participating in a market move rather than just how far a price-weighted index has traveled, with the advance/decline line, percent-above-moving-average, and McClellan Oscillator among the most widely used.
What are the primary breadth indicators?
The core set includes the Advance/Decline line, percent of stocks above key moving averages, the McClellan Oscillator and Summation Index, new highs versus new lows, and breadth-thrust signals like the Zweig Breadth Thrust.
Where can I check market breadth?
Live moving-average breadth data across thousands of US stocks is available through dashboards like thetrading.tools, while advance/decline line charts for major indexes can be found through resources like MarketInOut.
Is a strong breadth reading always bullish?
Not automatically.